Oracle
Portable Charting: See the Move, Make the Move
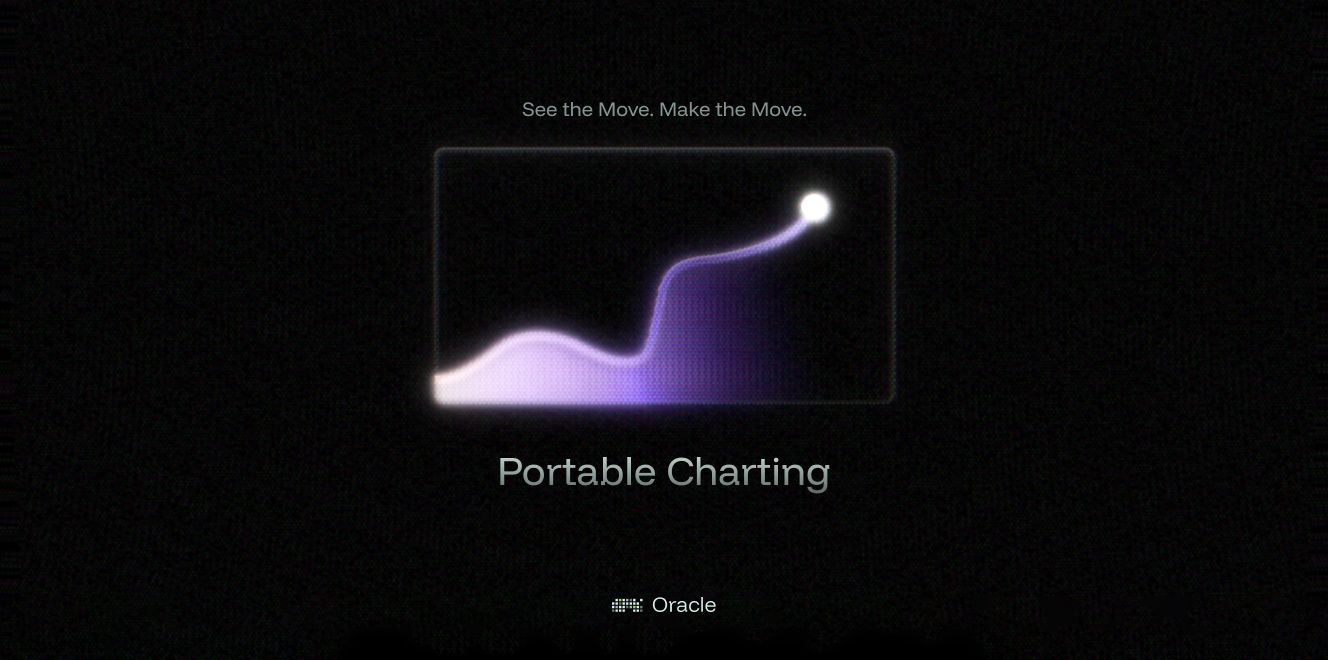
Oracle’s Chart window brings market data directly into your trading flow. With live OHLCV charts, quick timeframes, and detailed pool stats, you can track momentum, read liquidity, and execute swaps—all without leaving the screen.
1. Live Market Data, Unified View
Powered by GeckoTerminal, Oracle’s chart interface pulls live OHLCV data for thousands of trading pairs across supported chains. You can view 5m, 1h, 6h, 24h, and 7d timeframes to understand how price action is evolving in real time. Each chart includes:
- Current token pair and price.
- 24-hour volume and liquidity metrics.
- FDV and transaction counts.
- Latest trades feed, with links to block explorers for full transparency.
This gives you a professional-grade analysis tool built right into Oracle’s surface—fast, responsive, and chain-aware.
2. Pool Stats at a Glance
No more opening external tabs to check volume or liquidity. Oracle displays core pool data—FDV, 24h volume, liquidity, and trader count—right alongside your chart. All figures are sourced from verified DEX endpoints like Uniswap v3, Balancer, and PancakeSwap, aggregated and refreshed in real time.
You see exactly where market energy is flowing, so you can decide when to enter, exit, or bridge.
3. Swap Straight from the Chart
When the setup looks right, you don’t need to switch tabs or re-enter data. Oracle lets you route a swap directly from the chart—the token pair, route, and chain are pre-filled automatically. This connection between visualization and action means you can act on opportunity instantly, turning analysis into execution with a single confirmation.
4. Focused, Minimal Interface
The chart surface was built with focus in mind: dark palette, compact typography, and Framer Motion-driven transitions keep data readable and responsive. Timeframe selectors respond instantly, and transitions between pairs are nearly instantaneous thanks to Sim IDX indexing.
Why This Matters
DeFi analysis shouldn’t be a tab maze. Oracle’s portable charting system compresses discovery, analysis, and execution into a single surface. You see live data, verify pool health, and execute—all in one place.
It’s not just about charts—it’s about speed, precision, and the confidence to move the moment the market does.
Oracle
More to Explore
Keep the flow going — explore more stories that shape the Oracle ecosystem and the tech behind it.
Polished Performance
Motion and interaction refined for speed without noise.
Multi-Wallet Control
Link, switch, and execute across wallets instantly.
Cross-Chain Routing
Orders filled instantly by relayers, settled cheaply after.